
Understanding Discount Rates The Risk Free Rate – Part 1 of 5
One of the most important inputs surrounding the valuation of the business is the discount rate that is used in the analysis. This discount rate is the expected rate of return on the subject interest which in most cases is the equity in the value of an operating business. Most often in our practice, this equity is attached to a private business that is owner operated. Over the next few weeks, I will dig into the five key inputs that go into a discount rate.
Discount Rate Theory
The rate of return used to discount projected future income to present value must be a reasonable estimate of the return needed to attract the capital of a willing buyer in the marketplace given the level of risk inherent Company. The determination of this rate puts the appraiser in the role of surrogate analyst for a hypothetical, informed, typically motivated, arms-length financial buyer. The appropriate discount rate should be the expected rate of return available on alternative investment opportunities with comparable risk.
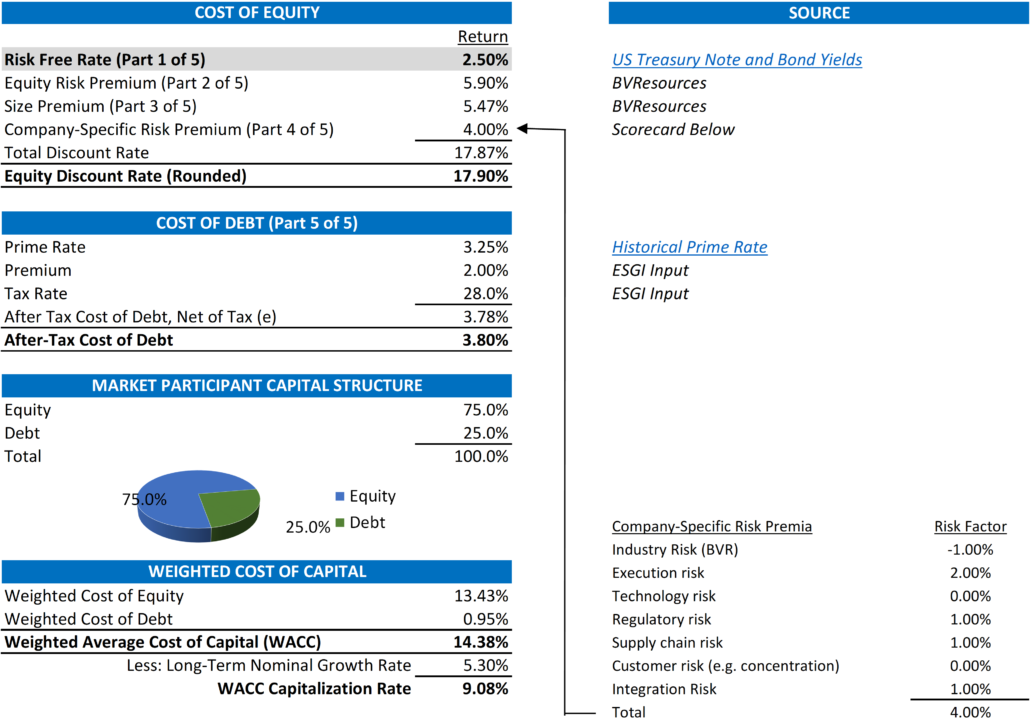
In determining the cost of equity, we use the build-up method which starts with a risk-free rate and adds risk components appropriate to the Company to arrive at a total discount rate. Risk premiums cover the incremental risk of equity investments in large-company stocks (vs. debt), the difference in risk between large and small public companies, and the risk of the specific investment (subject company) vs. the market overall. A highlight of how we build up both the cost of equity and the weighted cost of capital is pictured below. As noted, the highlighted input below refers to the risk free rate and the starting point of our build-up approach.
Basic Definitions
Before we dig in to comparisons let us define some common terms that we will use in our discussion [1];
- Risk-Free Rate of Return – The theoretical rate of return of an investment with zero risk. The risk-free rate represents the interest an investor would expect from an absolutely risk-free investment over a specified period of time.
- Treasury Yield – The return on investment, expressed as a percentage, on the U.S. government’s debt obligations. Looked at another way, the Treasury yield is the effective interest rate that the U.S. government pays to borrow money for different lengths of time.
- Mortgage Rate – The rate of interest charged on a mortgage. Mortgage rates are determined by the lender and can be either fixed, staying the same for the term of the mortgage, or variable, fluctuating with a benchmark interest rate.
- Correlation – Variables are correlated if the change in one is followed by a change in the other. Positive correlation describes the relationship between two variables which change together, while an inverse correlation describes the relationship between two variables which change in opposing directions. Inverse correlation is sometimes known as a negative correlation, which describes the same type of relationship between variables.
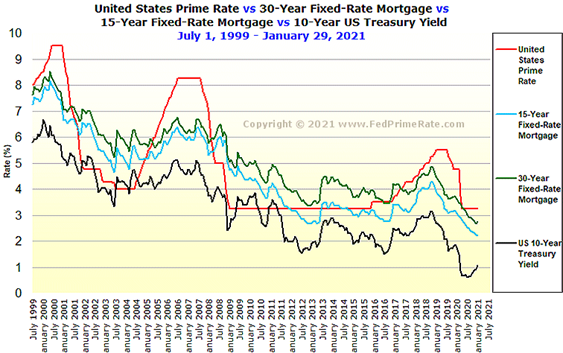
- Spread – The difference between two interest rates. For example, in the highlighted box on the chart below, there has been an uptick in the 10-year treasury yield but little to no change or a continued decline on the other rates. The difference between the black chart and the others at any particular date is the spread between those two rates.
As you can see from the graph below, there is a positive correlation between the three daily rates with almost mirror like lines showing the yields of the 15-year fixed rate mortgage, 30-year fixed rate mortgage and the US 10-year treasury yield rates over the last 21 years.
[1] Definitions care of www.nvestopedia.com
What Does This All Mean?
In the 2020 Berkshire Hathaway Annual Shareholders Meeting in early May 2020, in the midst of a global pandemic, Warren Buffett was asked if there is a risk that the US government would default on its debt, he answered “no”. “If you print bonds in your own currency, what happens to the currency will be the question,” said Buffett. “But you don’t default. The U.S. has been smart to issue its debt in its own currency.” So if there is a concern of default, the US government has the option to simply print more of its own currency to pay back the debt. This mitigation of this default risk is the main reason why the yield on a US treasury note or bond is considered “risk-free” or with zero risk.
So how does the above chart deal with risk-free rate? Simple. The line at the bottom of the graph is what we use as the risk-free rate and the starting point of our build-up approach above. In synch with the definitions above, we have assumed that the rate of US government’s debt obligations have zero risk and our build up approach to the discount rate is a function of adding risk to this “risk-free” rate.
In coming weeks we will deal with the other key inputs of our build-up approach.
Exit Strategies values control and minority ownership interests of private businesses for tax, financial reporting, strategic purposes. If you’d like help in this regard or have any related questions, you can reach Joe Orlando, ASA at 503-925-5510 or jorlando@exitstrategiesgroup.com.