The Risk Free Rate – Part 1 of 5
One of the most important inputs surrounding the valuation of the business is the discount rate that is used in the analysis. This discount rate is the expected rate of return on the subject interest which in most cases is the equity in the value of an operating business. Most often in our practice, this equity is attached to a private business that is owner operated. Over the next few weeks, I will dig into the five key inputs that go into a discount rate.
Discount Rate Theory
The rate of return used to discount projected future income to present value must be a reasonable estimate of the return needed to attract the capital of a willing buyer in the marketplace given the level of risk inherent Company. The determination of this rate puts the appraiser in the role of surrogate analyst for a hypothetical, informed, typically motivated, arms-length financial buyer. The appropriate discount rate should be the expected rate of return available on alternative investment opportunities with comparable risk.
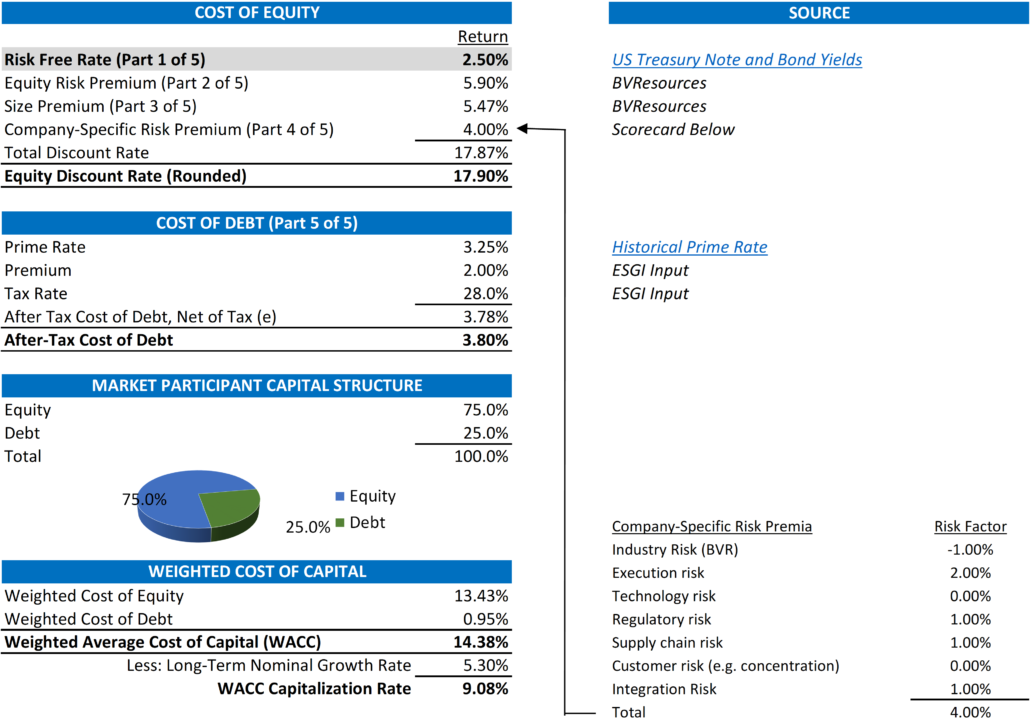
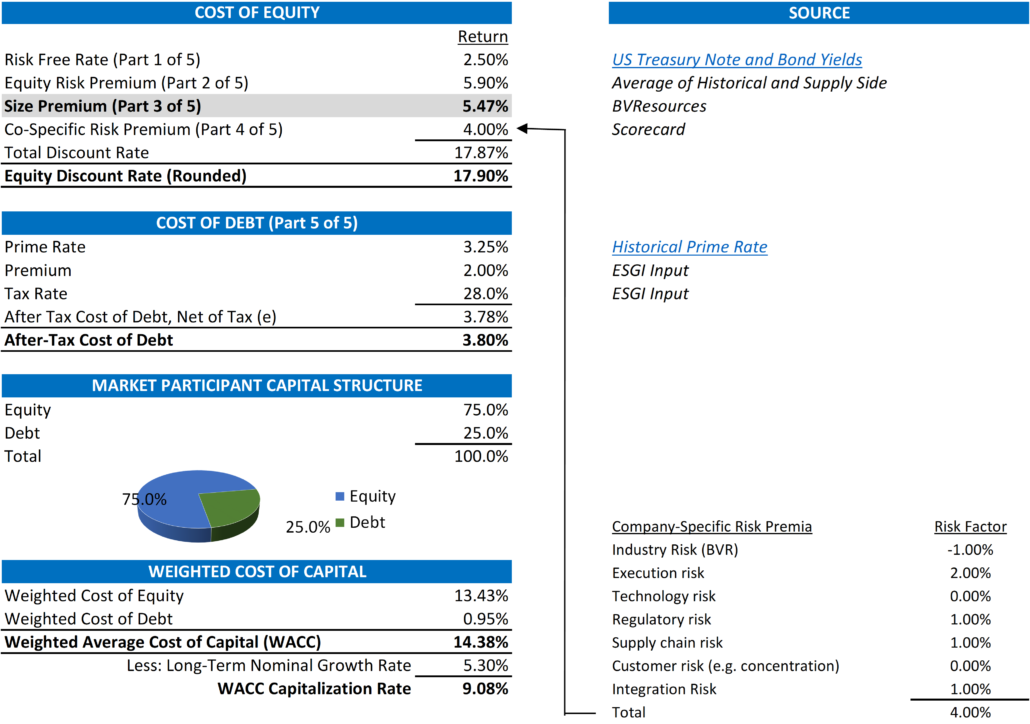
In determining the cost of equity, we use the build-up method which starts with a risk-free rate and adds risk components appropriate to the Company to arrive at a total discount rate. Risk premiums cover the incremental risk of equity investments in large-company stocks (vs. debt), the difference in risk between large and small public companies, and the risk of the specific investment (subject company) vs. the market overall. A highlight of how we build up both the cost of equity and the weighted cost of capital is pictured below. As noted, the highlighted input below refers to the risk free rate and the starting point of our build-up approach.
Basic Definitions
Before we dig in to comparisons let us define some common terms that we will use in our discussion [1];
- Risk-Free Rate of Return – The theoretical rate of return of an investment with zero risk. The risk-free rate represents the interest an investor would expect from an absolutely risk-free investment over a specified period of time.
- Treasury Yield – The return on investment, expressed as a percentage, on the U.S. government’s debt obligations. Looked at another way, the Treasury yield is the effective interest rate that the U.S. government pays to borrow money for different lengths of time.
- Mortgage Rate – The rate of interest charged on a mortgage. Mortgage rates are determined by the lender and can be either fixed, staying the same for the term of the mortgage, or variable, fluctuating with a benchmark interest rate.
- Correlation – Variables are correlated if the change in one is followed by a change in the other. Positive correlation describes the relationship between two variables which change together, while an inverse correlation describes the relationship between two variables which change in opposing directions. Inverse correlation is sometimes known as a negative correlation, which describes the same type of relationship between variables.
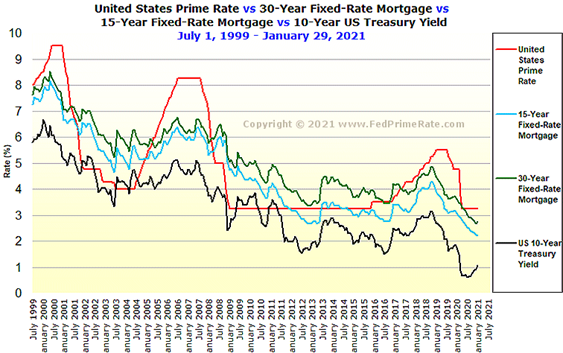
- Spread – The difference between two interest rates. For example, in the highlighted box on the chart below, there has been an uptick in the 10-year treasury yield but little to no change or a continued decline on the other rates. The difference between the black chart and the others at any particular date is the spread between those two rates.
As you can see from the graph below, there is a positive correlation between the three daily rates with almost mirror like lines showing the yields of the 15-year fixed rate mortgage, 30-year fixed rate mortgage and the US 10-year treasury yield rates over the last 21 years.
[1] Definitions care of www.Investopedia.com
What Does This All Mean?
In the 2020 Berkshire Hathaway Annual Shareholders Meeting in early May 2020, in the midst of a global pandemic, Warren Buffett was asked if there is a risk that the US government would default on its debt, he answered “no”.[2] “If you print bonds in your own currency, what happens to the currency will be the question,” said Buffett. “But you don’t default. The U.S. has been smart to issue its debt in its own currency.” [3]So if there is a concern of default, the US government has the option to simply print more of its own currency to pay back the debt. This mitigation of this default risk is the main reason why the yield on a US treasury note or bond is considered “risk-free” or with zero risk.
So how does the above chart deal with risk-free rate? Simple. The line at the bottom of the graph is what we use as the risk-free rate and the starting point of our build-up approach above. In synch with the definitions above, we have assumed that the rate of US government’s debt obligations have zero risk and our build up approach to the discount rate is a function of adding risk to this “risk-free” rate.
In coming weeks we will deal with the other key inputs of our build-up approach.
Exit Strategies values control and minority ownership interests of private businesses for tax, financial reporting, strategic purposes. If you’d like help in this regard or have any related questions, you can reach Joe Orlando, ASA at 503-925-5510 or jorlando@exitstrategiesgroup.com.
The Equity Risk Premium – Part 2 of 5
Our prior post and educational discussion of the discount rate as “one of the most important inputs surrounding the valuation of the business” introduced the first input of the build-up approach, the risk-free rate. The second key input is the equity risk premium. In our reports, we define this input as “The ERP represents the extra yields demanded and earned (and risk assumed) over time by equity investments in large public companies over U.S. Treasuries. This premium is sometimes referred to as the market risk premium. It is a measure of systematic risk of equity securities.”
Build-Up Approach – Equity Risk Premium (“ERP”)
Again, in determining the cost of equity, we use the build-up method which starts with a risk-free rate and adds risk components appropriate to the Company to arrive at a total discount rate. A highlight of how we build up both the cost of equity and the weighted cost of capital is pictured below. As noted, the highlighted;
 Basic Definitions
As shown we are using an ERP of 5.90% which is calculated as follows; “using the S&P 500 average annual return of 11.81% derived from CRSP data for the 1928 – 2020 period and a 5.91% 20-year T-Bond average annual return for the same timeframe.” Said another way, the ERP is difference between a long-term rate of return of a portfolio of equity securities (SP = S&P 500 over the last 72 tears) and a similar long-term risk free rate (RFR = T-Bond average annual return). [4]
ERP = SP – RFR = 11.81% – 5.91% = 5.90%
Investopedia sums up this concept with the following key take-aways;
1) The equity-risk premium predicts how much a stock will outperform risk-free investments over the long term.
2) Calculating the risk premium can be done by taking the estimated expected returns on stocks and subtracting them from the estimated expected return on risk-free bonds.
3) Estimating future stock returns is difficult, but can be done through an earnings-based or dividend-based approach.[5]
Below is a graphical depiction of the S&P 500 Index from 1928 through 2021 that includes dividends and supports the 11.81% return.[6]
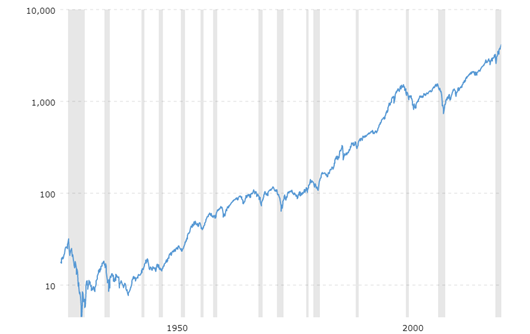
What Does This All Mean?
The discount rate is a simple build-up of risk. When valuing the equity of a privately held company, the starting point for this calculation is always a risk-free rate which represents a risk free debt security with little to no risk of default. Because the scope of work is the value of equity of a private equity security, we need to build up this rate with the risk associated with equity.
Stay tuned for Part 3 of 5, the Size Premium where the difference in risk between and small companies.
Exit Strategies values control and minority ownership interests of private businesses for tax, financial reporting, strategic purposes. If you’d like help in this regard or have any related questions, you can reach Joe Orlando, ASA at 503-925-5510 or jorlando@exitstrategiesgroup.com.
Understanding Discount Rates
The Size Premium – Part 3 of 5
So far, in our educational discussion of the discount rate as “one of the most important inputs surrounding the valuation of the business”, we introduced the first two inputs of the build-up approach. Added together, these two inputs equal the expected market return of equity. However, because the equity risk premium looks at the overall market returns, our build up approach needs to now focus on the Company we are valuing. The last two inputs to the cost of equity focus on the size of the Company and its “specific” risks that are not accounted for in the other four inputs
Again, a highlight of how we build up both the cost of equity and the weighted cost of capital is pictured below. As noted, the highlight deals with the size premium;
Build-Up Approach – Size Premium
The size premium is based on the simple premise that “size matters” when it comes to market returns but not the way you think. While this theory may seem simple, its proof is based on the analysis of stock returns from as far back as 1928. More complex theories, including those of Nobel Prize winning professors from the University of Chicago’s Booth School of Business suggest that the smaller a Company’s market capitalization (or share price times number of shares outstanding), the higher the stock’s compound average growth rate (“CAGR”) over time.[7] A graphical depiction of these returns are below where decile 10 represents the smallest and decile 1, the largest market caps.
[7] https://seekingalpha.com/article/1921171-examining-the-size-premium
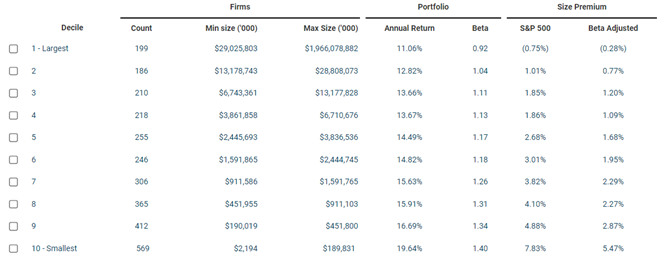
The detail above show the mean annual return for each decile between 1928 and 2020 and are represented both with and without an adjustment for each decile’s beta (or its volatility of stock prices compared to the overall market = 1.00). Because we mostly work with Companies below $189.8 million in market capitalization, our standard default size premium is Decile 10 or 5.47%.
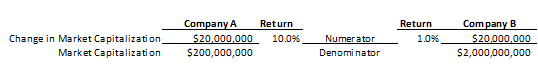
Another way to understand why smaller companies generate greater returns than bigger companies is the fact that the return is an increase by percentage rather than real dollar value. For example, a $200 million company that grows 10% grows its value by $20 million. If a $2.0 billion where to grow its value by $20 million, its return would only be 1.0%. Both companies grew the same amount (call it the numerator in this simple ratio below) but the denominator (the size of each company) is different.
What Does This All Mean?
The discount rate is a simple build-up of risk and size differences are the easiest to understand. It makes no sense to compare Microsoft to a small cloud-based software company unless you adjust for this size. Consider the additional risk added to the discount rate for a small software company as the additional return an investor would need to receive for investing in a riskier, early stage stock.
Stay tuned for Part 4 of 5, the Company Specific Risk Premium where we adjust returns for the specific characteristics of the Company we are valuing.
Exit Strategies values control and minority ownership interests of private businesses for tax, financial reporting, strategic purposes. If you’d like help in this regard or have any related questions, you can reach Joe Orlando, ASA at 503-925-5510 or jorlando@exitstrategiesgroup.com.
Understanding Discount Rates The Company Specific Risk Premium – Part 4 of 5
Up until now, our discussion of the discount rate as “one of the most important inputs surrounding the valuation of the business” has focused on overall market data that arrives at the basis of risk associated with the cost of equity for a privately held company. We’ve begun with a risk-free rate and added risk for equity and size. Now, we need to look at the subject company to determine if we should add any additional risk for factors not accounted for in the first three inputs. For example, does the business have a strong management team? Is risk impacted by the industry in which it competes? Is there risk in the supply chain in securing the products needed to produce the company’s products? All of this risk is accounted for in the Company-Specific Risk Premium (or CSRP).
Again, a highlight of how we build up both the cost of equity and the weighted cost of capital is pictured below. As noted, the highlight deals with our discussion of the CSRP which is built out below and to the right of this summary;
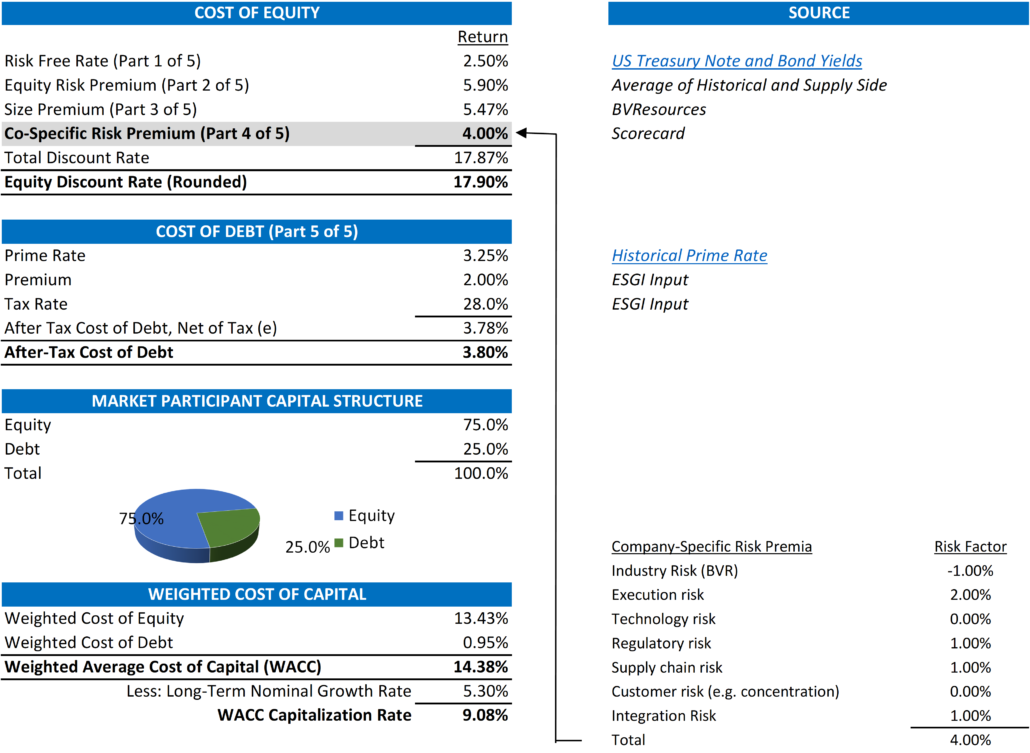
Build-Up Approach – Company-Specific Risk Premium
As noted above and highlighted in the matrix that identifies and quantifies this risk, all of these factors relate to the business, how it competes as well in the environment in which the company and its industry compete. To dig into the list above, let’s assume that the subject company is a small chain of liquor stores located in a mid-sized but growing metropolitan area; Sonoma County, CA where Exit Strategies is headquartered.
Below is an enlarged copy of the matrix outlined above. As you can see, it is a list of risk categories that are not related to the overall market (type of security and size) but instead associated with the company’s business model, how it navigates the unique challenges of executing on it, and how it competes with other in its industry. A discussion of the specific rationale for adding (and subtracting) risk to the subject business; a liquor store in Sonoma County.
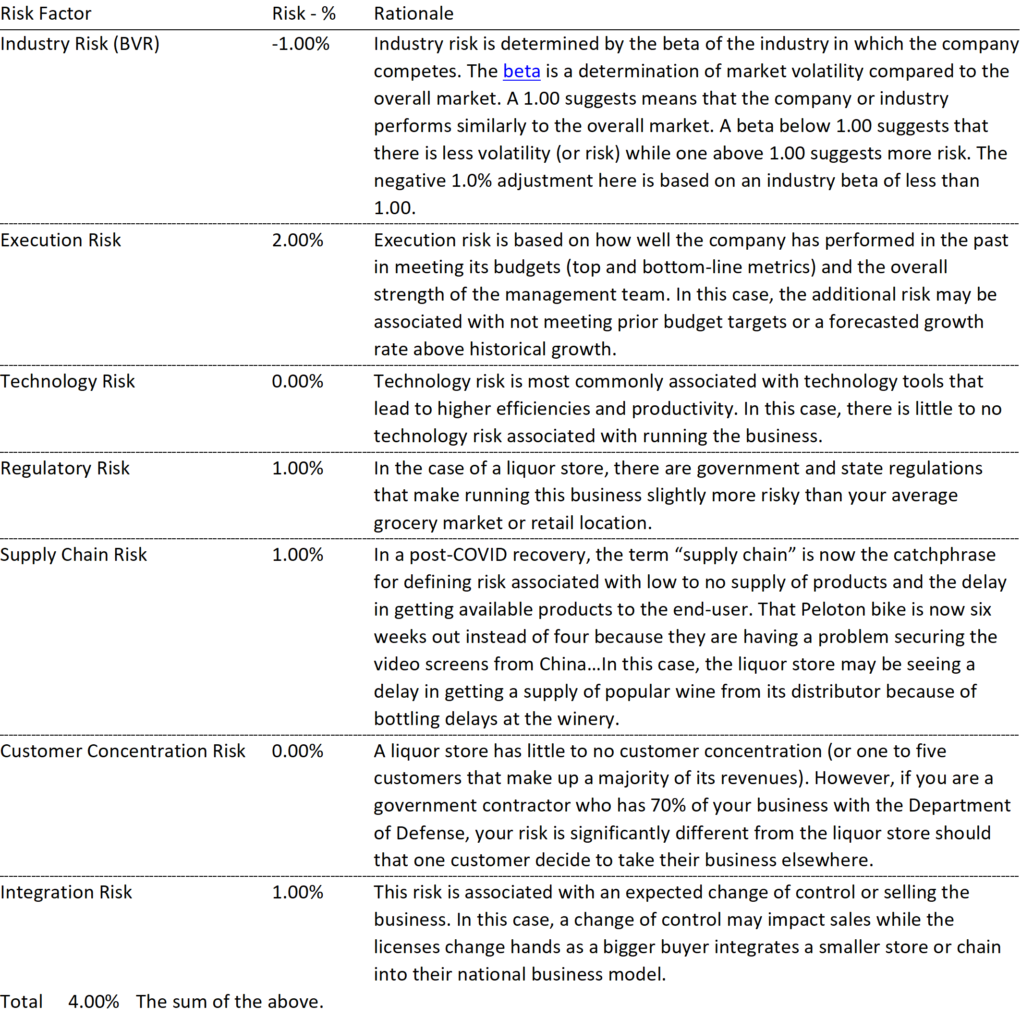
Fair Market Value is defined as “the price at which the property would change hands between a willing buyer and a willing seller when the former is not under any compulsion to buy and the latter is not under any compulsion to sell, both parties having reasonable knowledge of relevant facts.” In determining this value using an income approach and discount rate, the above list is what a valuation expert would expect a willing buyer to see as an incremental risk to buying the business.
However, a willing buyer (or even a willing seller two years before selling the business) can look at this list as a “to-do” to increase value by “de-risking” the business associated with these specific risks.
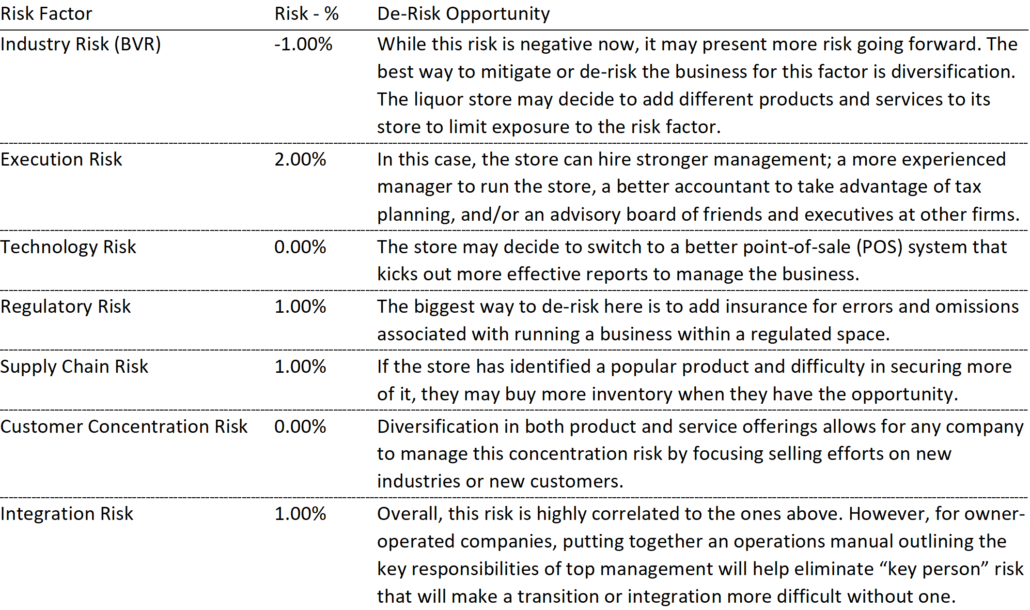
What Does This All Mean?
All other key inputs (cash flows and long-term growth) de-risking the business for these company-specific risks will increase the value of the business. Less risk correlates to higher values. However, there may be a tradeoff in de-risking and value with an increased cost structure (insurance, technology tools, increased staff). In this case, the real challenge for management is leveraging these incremental costs by increasing revenue and profits.
Stay tuned for our last installment where we look at the cost of debt and how the ability to secure debt over equity lowers your discount rate and has a positive impact on value.
Understanding Discount Rates
The Cost of Debt and the Debt to Capital Ratio – Part 5 of 5
The first four parts of this five-part blog have dealt solely with the components of the buildup approach and the determination of a cost of equity. However, when determining a discount rate, it is important not to forget the ability to access debt. Each of the preceding parts of this discussion focuses on the cost of equity. This last part introduces the cost of debt and the debt to equity ratio in determining the weighted cost of capital (or “WACC”).
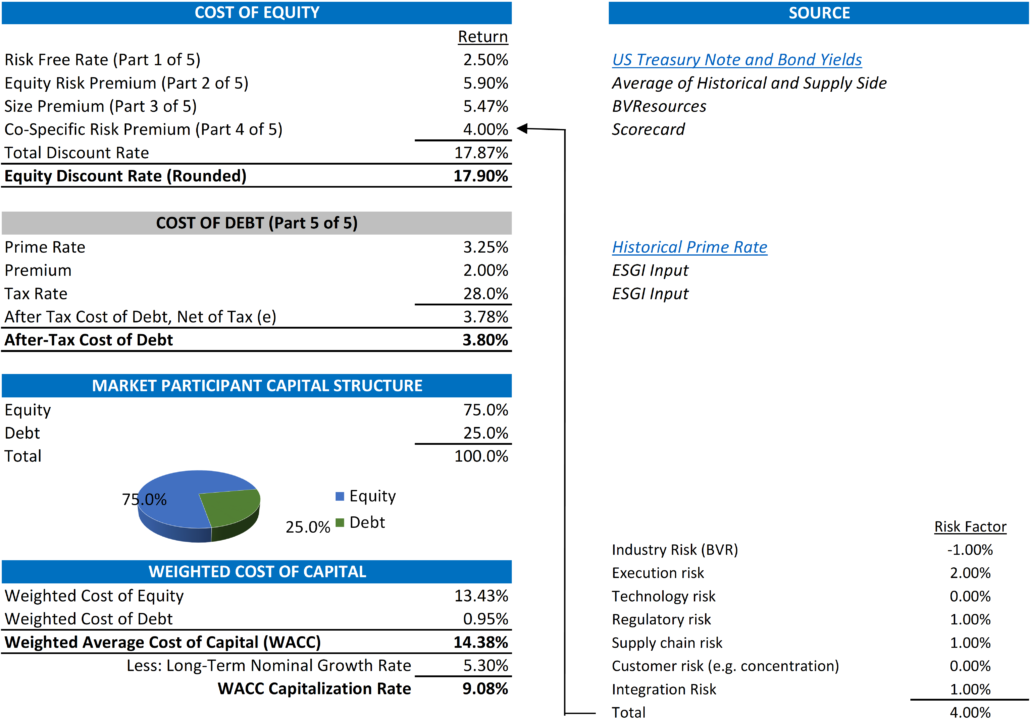
Build-Up Approach – Cost of Debt
In short, invested capital is equal to a Company’s capitalization or the total value of equity and debt. In our simple example above in determining the discount rate as the WACC, we are assuming debt is equal to bank debt only. While this assumption simplifies the determination of a discount rate, it also represents what would be needed in bank debt to settle the outstanding debt and obligations highlighted in the definition above.
The cost of debt is the interest rate (or the cost of borrowing debt) a Company pays on its debts. Similar to the build-up of the cost of equity, we start with a base rate of interest for a risk-free investment. While the cost of equity highlights this base rate as the cost of a US Treasury Note or Bond, the base cost of debt is identified by the prime lending rate (or “Prime Rate”). “The Prime Rate is the interest rate that commercial banks charge their most creditworthy corporate clients.”[8]
Similar to borrowing money to buy a house, the rate at which an individual or Company can borrow money depends on the collateral or the value of the asset used to secure a loan. Therefore, the rate at which a Company borrows money is based on the value of the assets that a bank can access if the Company defaults on the loan. How banks determine this collateral is a topic for another post. But banks are very similar to investors. The greater the risk, the greater return they require. As noted above, the “lever” to account for the risk is the premium a Company pays above the base Prime Rate. In our case, we have assumed a 2.0% (or 200 basis points where 100 basis points = 1%) as an example. Companies with more tangible assets should be able to get a lower rate. Companies with less tangible assets (think a start-up software company) will likely need to pay a greater premium. Of note, once this rate is determined, it is appropriate to use the after-tax cost of debt because a Company can utilize interest as an operating expense that lowers its tax liability.
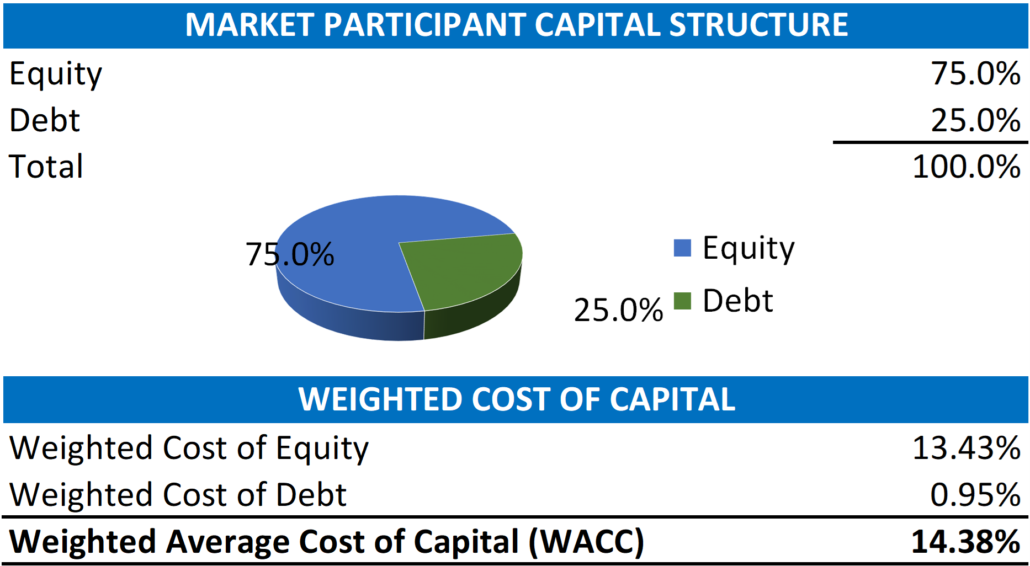
Calculating WACC
So now that we have identified the approach to determining the cost of equity and the cost of debt and concluded that a discount rate is equal to the weighted average cost of capital or WACC, we come to the end of our discussion with one last important input to finally determine the WACC. This input is equal to the assumed amount of debt we apply to the capital structure (where the amount of equity is equal to 100% – the % amount of debt). Again, with a mortgage for a house, a lender usually requires at least 20% equity so the debt (or mortgage amount) is equal to 80%. For a business, these weightings have two key drivers, and the decision on which one to use is based on the scope of the valuation or analysis.
The two key drivers for a valuation are the % of the debt of the subject Company or the % of the debt that a market participant (or an investor in the industry) would likely have the ability to borrow. For the valuation of minority ownership (say a single share or 1.0% of a Company), the valuation is of a minority ownership interest. Because a minority owner has no control over how the Company spends (or borrows) money, we use the Company’s current % of debt to capital. For the valuation of a controlling ownership interest (greater than 50%), we assume that the potential buyer has the control to negotiate a deal with a bank based (like a mortgage) on how much equity is required to contribute to investment.
Once this % is determined, the calculation of the discount rate is a simple weighting exercise outlined below;
What Does This All Mean?
The Cost of Debt and the amount of debt used in the calculation of WACC is both the last and for some companies the most important component of the discount rate. Debt helps mitigate overall risk by lowering the cost of an investment. It is a key component of corporate strategies that look to invest in projects with “cheap money” by leveraging their assets to grow their business. As such, it allows them to capture a more significant return on that investment.
[1] Definitions care of www.nvestopedia.com
[2] https://finance.yahoo.com/news/warren-buffett-explains-the-simple-reason-why-the-us-will-never-default-on-its-debt-185105213.html
[3] Ibid.
[4] https://www.bvresources.com/products/cost-of-capital-professional
[5] https://www.investopedia.com/investing/calculating-equity-risk-premium/
[6] https://www.macrotrends.net/2324/sp-500-historical-chart-data
[7] https://seekingalpha.com/article/1921171-examining-the-size-premium
[8] https://www.investopedia.com/terms/p/primerate.asp
Exit Strategies values control and minority ownership interests of private businesses for tax, financial reporting, strategic purposes. If you’d like help in this regard or have any related questions, you can reach Joe Orlando, ASA at 503-925-5510 or jorlando@exitstrategiesgroup.com.