
Understanding Discount Rates The Size Premium – Part 3 of 5
So far, in our educational discussion of the discount rate as “one of the most important inputs surrounding the valuation of the business”, we introduced the first two inputs of the build-up approach. Added together, these two inputs equal the expected market return of equity. However, because the equity risk premium looks at the overall market returns, our build up approach needs to now focus on the Company we are valuing. The last two inputs to the cost of equity focus on the size of the Company and its “specific” risks that are not accounted for in the other four inputs
Again, a highlight of how we build up both the cost of equity and the weighted cost of capital is pictured below. As noted, the highlight deals with the size premium;
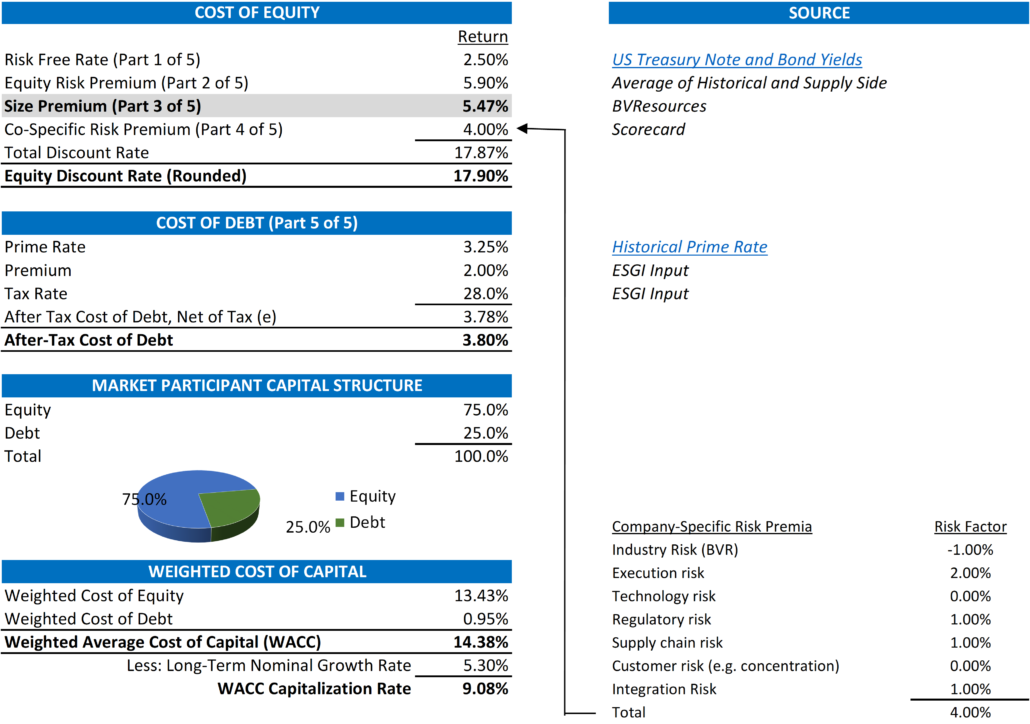
Build-Up Approach – Size Premium
The size premium is based on the simple premise that “size matters” when it comes to market returns but not the way you think. While this theory may seem simple, its proof is based on the analysis of stock returns from as far back as 1928. More complex theories, including those of Nobel Prize winning professors from the University of Chicago’s Booth School of Business suggest that the smaller a Company’s market capitalization (or share price times number of shares outstanding), the higher the stock’s compound average growth rate (“CAGR”) over time.[1] A graphical depiction of these returns are below where decile 10 represents the smallest and decile 1, the largest market caps.
[1] https://seekingalpha.com/article/1921171-examining-the-size-premium
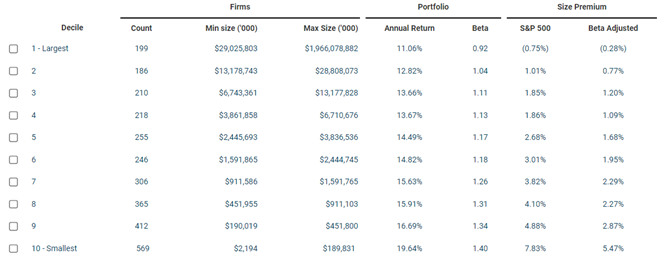
The detail above show the mean annual return for each decile between 1928 and 2020 and are represented both with and without an adjustment for each decile’s beta (or its volatility of stock prices compared to the overall market = 1.00). Because we mostly work with Companies below $189.8 million in market capitalization, our standard default size premium is Decile 10 or 5.47%.
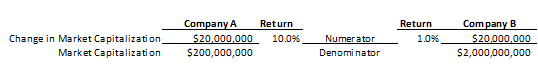
Another way to understand why smaller companies generate greater returns than bigger companies is the fact that the return is an increase by percentage rather than real dollar value. For example, a $200 million company that grows 10% grows its value by $20 million. If a $2.0 billion where to grow its value by $20 million, its return would only be 1.0%. Both companies grew the same amount (call it the numerator in this simple ratio below) but the denominator (the size of each company) is different.
What Does This All Mean?
The discount rate is a simple build-up of risk and size differences are the easiest to understand. It makes no sense to compare Microsoft to a small cloud-based software company unless you adjust for this size. Consider the additional risk added to the discount rate for a small software company as the additional return an investor would need to receive for investing in a riskier, early stage stock.
Stay tuned for Part 4 of 5, the Company Specific Risk Premium where we adjust returns for the specific characteristics of the Company we are valuing.
Exit Strategies values control and minority ownership interests of private businesses for tax, financial reporting, strategic purposes. If you’d like help in this regard or have any related questions, you can reach Joe Orlando, ASA at 503-925-5510 or jorlando@exitstrategiesgroup.com.